Reference

Showing posts with label Energy conservation. Show all posts

Google outsmarts the smart grid

Will Google take a multi-trillion dollar industry to the mat?

In the press this week Bloomberg broke a story:
Google Said to Plan Energy Push With Tools for Utilities 

and Forbes responded 


As noted this is probably an alternative to the energy saving play Google made some years back http://www.google.com/powermeter/about/

They backed out of powermeter in late 2011, surrounded by rumours that the utilities did not want to play ball (i.e. share their client data with Google ) despite Big Data analytics being of obvious potential interest to their end-user clients.

If so the game-plan for the utilities may have back-fired as this new Google approach looks far better thought through and far more of a threat to the utilities.

But these articles miss the point !

Why ?  - While united the Smart Energy Demand Coalition is far more interesting than any individual utility (because it represents an umbrella concept) , I believe Google is finding a path straight to the money!

 Members of Smart Energy Demand Coalition might all want to watch Google:

SEDC Executive Members - An influential bunch (particularly in Europe)
A little background - The Automatic Meter Reading (AMR) market is a $multi-billion land grab that is going on with big utilities, and big metering operations participating. Note: the smart meter industry is a tiny subset of AMR

However it is famously said that:

During a gold rush you want to be either the guy selling picks and shovels or the gal making the jewellery.

I believe (and suspect Google sees) that these players are all leaving most of the money on the table,


SEDC Associate Members - No less impressive Global Titans here too!

This team looks pretty Smart to me to so how can Google Outsmart them ?

This play is more mature - 

Absent deregulated markets utilities "own" their clients ( In the US location largely determines your utility provider) . 

So deregulated markets face more competition than US counterparts (like uncompetitive providers of last mile ISP access in the US).

Maybe this is why the SEDC first sprang up in Europe as brain child of VaasaETT (The Global Energy Think Tank)

However, even in the US there is a "bigger grid" where loads can be advantageously shed between states (because time-zones and weather events and hence demand are highly regionalised too). 

In this market the infrastructure provider is key and no utility can own the market. So Google can access this without co-operation or partnership  from utilities, because those that will not sit at this table will lose!

And here is the winning play

If Google can also deliver demand intelligence (via some grid independent API) at the point of use they can effectively cut out the utility entirely (except as low-margin commodity provider).

The point is that however big the AMR market is, the main purpose of that market is to deliver efficiency and data intelligence to end users and support them better by smarter matching of supply to demand.

Almost universally providers of meter data also provide visualisations (charts) because it is easy.

Very few offer analytics  (kWIQly clients are an exception), and we know Google is in this market.  It is acting on intelligence delivered by analytics that is where the value lies.

The domain intelligence and pattern recognition that can unbundle value from these near infinite (and fast growing) data streams and then package it up as simple sophisticated solutions is worth a lot. It scales and reduces utilities back to what they are - a pure commodity play.

Prognosis

It is very simple and needs only a superficial understanding of how industrial disruption ( http://www.claytonchristensen.com/books/the-innovators-dilemma/ ).

Either existing industries (AMR, Utilities, Construction and Heavy machinery) will collaborate to deliver the value the markets (and Climate Change) are crying out for, or Google will pip them at the post.

The requirements are really quite simple -

1)  Good real-time tariff APIs for end-users (via packaged intelligence) to know what energy costs and likely will cost
2) Ability to mine for energy saving opportunity in AMR data (pattern recognition)
3) Connectible plant that can exploit the opportunities so discovered automatically

Either this will be delivered piecemeal (and a later consolidation and sharing of protocols will happen) or it will be delivered via a protocol open to all from the start - which will freeze out Google as a commodity provider (except where they really have the specialised domain expertise ).

Punditry

As a big player in this field you need to prepare three things:
  1. A collaborative attitude with peers (utilities and network infrastructure must play well with competitors via open protocols etc - so that specialist service providers have access to the field)
  2. Emergent domain specialist operations (kWIQly is a bit too small just yet) must be hand-held to break into big markets (in land-grab markets first entrants that scale fast hold long term estate value)
  3. A dialogue with existing (commodity clients) that can up-sell and cross-sell new differentiated value propositions identified as suiting them from their energy data - this will reduce churn (enhance client retention) and convert their data into an asset - rather than leaving it unexploited in a database.
As a smaller niche player:

It's all about exposing value (eg via APIs) and creating value propositions that exploit network effects (Small businesses or startups that do not understand this concept need to) and being prepared to partner for growth (rather than trying to row organically) - because speed is of essence.

 As Google

Define the Smart Demand/Supply interfaces to allow the niche products to bypass the utilities with readily installable Gizmos and cut out the middle man. (Maybe acquire these once they show traction)

Meanwhile provide a set of tools that utilities must use (or suffer the consequences) to ensure their adoption of your API's - Oh but you are doing that already !
Related articles

LeWeb manages energy in Paris - How so ?

LeWeb Logo
Add caption - Go on try !
Win free trip to their website :)
Hi again fair reader !

I just wanted to let you know that (whether you are in fact fair or not) - We are honoured to have been chosen as one of the sixteen startup finalists for LeWeb in Paris 4th, 5th, 6th December 2012.  

A patronising post on energy savings

So today a rewarding look at a couple of charts to look at ( not as immensely boring as it sounds) ...

But first  - Imagine if you will, that you had previously been in contact with us - the upshot being that for a very reasonable price you would be well served in the whole saving energy effectively department. Aren't you lucky - you (being wiser than most) can save time by not reading the rest of this post.

BACK TO REALITY
However, for the rest of you, it is only fair we tell a little about the things in energy management that excite us most.


Picture of a pie and pint taken for enwiki-p's...
A "pie and pint"  (Photo credit: Wikipedia)

Consider for a moment a pub, not just any pub, but a "better" pub. If you have been paying attention you will also know that boiler energy saving is like running a bar !

BTW - a word to the wise ! -  If you have not been there do have a look - firstly for the *ahem* brilliance of the analogy it offers, and secondly for the wonderful picture at the top of the post.


You have to love a disaster it - clearly he does ! 

And what is better than running a better pub I hear you ask (rhetorically) ? -
"Why - drinking in a better pub of course ! "

So, the problem today is as ever how to address the problem
- How do I get to be sitting in a better pub ?

The answer naturally is that as an energy manager - you need one of three things :

a) A better job
b) If a) is not available - more respect in the job you have
c) Failing a) and b) - you need to gain respect.

And that is why we are here ...
CLICK TO ENLARGE
If you did so (that is - click to enlarge) you will have seen that the chart above is of a pub. The energy use to be precise - if you are smart you will be able to figure out when they are open. (And this is why you should know it's a pub!)

The faint line at the top is the most this pub spends (by hour of week).  The green is what it should be using if all is well under the current conditions - and the red - Well the red is the current weeks level of "spillage". That which is to be avoided!
CLICK TO ENLARGE
OK - I was just kidding ! - naturally the chart doesn't show you when they are open. It does show you when they are using energy, and that is not the same thing !

If you are observant you will see that the energy use is "even better than ideal" on Tuesday evening - In other words - a mistake !

Since nobody changed the time-clocks for Daylight Savings Time.

The mice are cosy before the pub opens, and the punters are cold when they leave in the evening.

What is that ugly red spike at 9.am.  ?

The ugly red-spike is a boiler boosting hot water to above its necessary temperature.  We know this because it then switches on and off all day.  This is known as slow dry cycling - the load does not warrant the activity - so the boiler overheats the system, then slowly cools down before doing the same again.

If it just did a little when it was needed - it would cost less, the room temperature would be more stable (more comfortable - and less likely that someone opens the door for a bit of fresh air - as often happens in autumn).

Now there are lots more things I could tell you - like the implications of the high load line over-night (maybe I'll post on that another day)...

So you reward for having got this far is that you are better informed (maybe) - or perhaps more likely - you disagree with drinking beer  - in which case please feel free to express yourself elsewhere !
Enhanced by Zemanta

Pareto principal - get your ducks in a row


ducks in a row
ducks in a row (Photo credit: Wikipedia)
This post makes sense to any entrepreneur or manager needing to gauge how to allocate resources efficiently to get a best return.

As ever, we will illustrate using energy management (or the lack of it) because we are kWIQly, and also because the ideas are familiar to everyone.

Problems, energy waste or if you insist "energy savings opportunities" (why can't we call it what it is - a disaster - are we so afraid of the truth ?")  can be characterised. 
Suicide Is Painless
Suicide Is Painless (Photo credit: Wikipedia)

It is this grouping or triage of priority as we mentioned in "kWIQly - Don't Panic" that allows a low cost rational application of resources.

It should not be complex, but crystal clear (it needs to work on the battlefield when under pressure). 

Triage should not fly in the face of common sense, because the managers (nurses, energy managers, generals) need to trust it without thought, so it also needs to be "light-weight", convenient and agile (and well-considered).

If you had queued in a hospital for two hours bleeding to death this would be obvious to you - common sense rapid assessment saves lives!  - Are you old enough to remember M.A.S.H - triage exemplified ;)

Equally, the response shown by someone lacking triage is the "headless chicken" where a manager is flustered, cannot justify decisions and is simply not effective.

Panic - When visceral dominates rational is a brief post about how this indecision applies to our society as a whole confronting climate-change - but today I want to focus on us - individuals...

Anyone who cannot tell priorities apart is not an energy manager (or perhaps does not have the right tool for the job).

English: Studio photo of peas in their pods.
English: Studio photo of peas in their pods. (Photo credit: Wikipedia)
Lets consider just a few characteristics that can make all the difference.

We know what the Pareto principal says. It was initially conceived by Joseph M. Juran a 20th Century leading light in Quality Management when he noticed that 20% of the pea pods in his garden yielded 80% of his peas.

 It basically says that things are not normally evenly distributed (buses and taxis come in clumps), blackberries on a bush are biggest in clusters, and in general that life is not "fair".

This has profound implications...

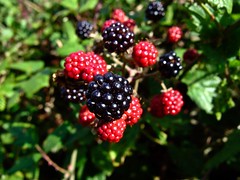
Blackberry
Blackberry (Photo credit: Lastaii)
It means if you have so much time to pick berries you better start in the most fruitful area.

If you are selling anything location counts.

And so on.

However in some fields, Pareto analysis is multi-faceted (even assuming you have the necessary data to begin with).

So back to our archetypal energy manager (I must remember to do a post about our archetypes), but lets call her Sally for now.
English: Oak Moss and Truffle Toast.
English: Oak Moss and Truffle Toast. (Photo credit: Wikipedia)

She manages energy for 100 truffle outlets (the things pigs dig up not the gooey chocolate filling).

These are distributed some in the US, one in Brienz (just down the road from me) and a handful elsewhere maybe say Singapore where air conditioning is a challenge.

She is a finite resource (not corporally) and though imposing she can only be in one place at a time.

So she needs to prioritize!  

We asked her to make a list of the things she needs to know ( take note because there will be a question about these facets later ! ) - this is what she comes up with.

Overview - The context is always "Where" because it represents her limited resource  - visits to manage energy cost time!
(We assume for this exercise she can just go there and wave a wand - many energy managers are guilty of believing in this method - maybe subject for another post soon ! )

Immediate priority - Blitz Action
"Where ?"  - kWIQly - Geographic Triage 
Where do I find the 20 stores that are wasting (wasting not using!!!) 80% of my energy right now ?

Substantial performance - Annual Returns
Where do I find the 5 stores that wasted most energy last year ?

Least Performant - The current "basket cases"
Where do I find the stores  who have exceeded ideal consumption by the greatest proportion (this month) ?

Most Chronic Problem - Weed out malingerers
Where is the single store that has been under-performing for the longest time ?(measured against a threshold or in absolute terms)

Most dissolute - The "drip-drip-drip" losses
Where has the cost of continual losses mounted up most ?
(a world site ranking - as a rolling average over a range of time periods)

This is obviously not all Sally needs to know - once she has selected a "patient" to treat, she will for example need tools to diagnose the causes more thoroughly .

But given that she has all this on her desktop in browser on a day-plus-one basis, we can probably agree - Sally knows what she needs to "get her ducks in a row".

Now I promised you a question about facets of your job - (it applies to anyone but particularly energy managers)..

Of these things Sally needs to know - "How many can you do without ?"

Bonus questions -  "How many do you have ?"

Obviously each of the above addresses a different facet of the problem (recency, severity, term, significance, attitude and intractability) and a manager must manage - ie decide how to allocate resources, but we argue that without the data the decisions are hypotheses or perhaps just guesses - 

"And that ain't energy management !"

Note given smart-meter data and the location of the sites (and opening hours if any) - we can answer the above questions for less than the price of a cup of coffee and a donut each week - Can you ?

Reach Out to us if you need help or if you think we have this all wrong - please comment below - we would love the feedback !


Enhanced by Zemanta

Energy Savings Frauds #3 (The lie you tell yourself)

Energy Savings Frauds - #3 - The biggest lie

(The lie you tell yourself)
Publicity photo of Jodie Foster and Christophe...
Wonderful scams as entertainment
 Paper Moon. (Photo credit: Wikipedia)

OK today we are going to mix it up - and its a slightly longer post than usual.


Instead of me selling you a lie, and you guessing how the scam works, I am going to explain how the scam works - and you dear reader, have the daunting task of thinking what lies might be sold using this scam.

Hint - if you can establish control over how people manage their decisions, then they are vulnerable.  The key to doing this is allowing them to believe they are in control.

This scam is a variation on the "measurement scam" and frankly it works best (as do many cons) on lazy, greedy people.  

It works by letting the sucker do the selling and the thinking themselves, and lazy, greedy people are very happy to be suckers!

Since all our readers have by definition powerful intelligence on their side (and none are lazy or greedy) , It will be necessary to lull you into a false sense of stupidity!  Please just work with me on this :)  


1962 ... 'To Kill a Mockingbird'
1962 ... 'To Kill a Mockingbird' (Photo credit: x-ray delta one)
For the record, anyone who disagrees with the above - do post about it in the comments, it may make for entertaining reading.

Now, if I said - "You can appear more intelligent by considering what an intelligent person would do - and then by doing that", you might think I was kidding you. Nonsense - or not ? (if you actually think about this before reading on - you are in the minority of the public at large - so I need you to be lazy this time !) ?

On reflection, perhaps if this did not convince you it would make you more intelligent, I might be able to convince you that it will make you "appear" more intelligent.

Now, imagine watching someone considering facts and options, weighing them earnestly, and then decisively declaring conclusions.  Sounds a pretty intelligent way of going about things doesn't it ? - deliberating!

However, deliberating is an internal thing - it has no actual "appearance" , the external furrowed brow, the stroked chin - these are the things of Hollywood - picture Gregory Peck in "To Kill a Mocking Bird".  (a must-see if you have not  - and a superb study of acting intelligent)

So, yes, considering what an intelligent person would do "does" make you look like you are doing what an intelligent person does - "thinking".  And - you also give yourself time for thought, reflection, to turn it over in your mind.

Now imagine instead I had said - "It will appear to others that you are more intelligent if instead of making rushed decisions, you give your mind a little time for thought".  This may not appeal to your vanity (we all want to be on the ball or sharp) - but it's hard to argue (again please try below :)

A shell game is performed on a cardboard box w...
A shell game is performed on a cardboard box with bottle caps on Fulton Street in New York City. (Photo credit: Wikipedia)
OK - so if you accept what I have written, so far (and not as a cheap trick), then you can be persuaded. - And this makes you vulnerable to believing the things you "want to believe" - and when we believe the things we want to believe  we are confident in these thoughts.  - Yes literally a confidence trick !

So selling energy-savings is very much like selling weight loss. There are three targets. People who use too much (food or energy) and know it. People who care what others think. People who would like an easy way to change things about themselves.  Naturally the best target is someone who has all three of these characteristics.  And naturally these characteristics describe 99% of all energy managers. In turn again - ask yourself:

Do we use to much energy ?  - If not why are you here ?
Do we care what people think ? - Brand, image company reputation
Would it be nice to have an easy way to fix it ? - Well doh - (lazy) !

So, pots of gold are far and few between, I have no pixie-dust.  But lets dream.

Before we do - lets measure ourselves - stand on the scales or check our energy consumption.

Here the con bites - it's boring, almost nobody does the job properly and we are shouting "Bring on the pixie dust"
Standard deviation illustration
Standard deviation illustration (Photo credit: Wikipedia)

BTW - if you have a years energy history with say +/- 30% standard deviation
from forecast consumption at half-hourly resolution - let me be clear - congratulations - you are not normal !

To the dream... - Imagine if you will that by merely thinking about weight and exercise and energy use you could shed pounds ( or kWh ) overnight  - in your sleep perhaps while listening to motivational "bad science" (BS).  What a wonderful world !

Now wake up, and measure yourself carefully every day for a year.  By the way - If you are lazy or not conscientious - don't blame the pixie-dust - you are at fault, But if you do and you find you lose weight (save energy) be proud - slap yourself on the back.

But now snap out of it.  Imagine a million suckers -

70 % quit early and blame themselves - These stay quiet - unless pushed and defensive ("the technology was fine but we had to re-position our strategic priorities") - Some accidentally do see a win at the end of the year and claim it was their diligence !


25 % do try - but because of reading errors before the trial and general inattentiveness, they will unintentionally suffer confirmation bias  so more than half of them see savings ( just like weight loss programs ).

4% Try, fail and wonder what they did wrong.

1% - Are intelligent enough to know their science and their psychology, and are somewhat sceptical - and these deserve the title - Energy Manager

Make sure there are no comments below - wouldn't want to miss out on anything entertaining :)
Enhanced by Zemanta

Energy Saving Fraud - #1

This post explains one if the easiest energy saving frauds in the world.


Yesterday, we discussed the idea of treating energy managers like mushrooms (keep in the dark and feed BS) and "lies, damned-lies, and statistics" which led to this post. So if you have jumped straight into the page have a read of feeding lies to energy managers first.


The subject today is a simple explanation of why the following is a case of a statistic that is a "damned lie":

"We have an energy saving product that will save you > 15% in 'seasonally adjusted savings'.  We will look at your last six months bills and get a pattern of use that is weather adjusted, we will implement product "X" in summer and monitor for another six months, and then you will use less energy, even after we have adjusted for the weather."


So, what is the implicit assumption here ? -  it is absolutely obvious!


Answer : It assumes there is an the amount of heating energy you normally spend that depends on primarily on the weather !


This sounds reasonable - cold day - more heat - right ?


Wrong !


In reality the vast proportion of buildings do not work like this !

This is an alarming claim, so I will have to explain it (I have met a couple of energy managers over the years who immediately understood this - but it is complex, so excuse me if I spoon-feed a little).

To maintain comfort the above assumption is exactly right - this is the basis of degree-day analysis, by which most of the energy managers in the world are taught to analyse (and reasonably so - "but as a first approximation" ).

Degree-Day Energy Management Theory chart
So here is the theory you were taught (and on which all degree-day analysis is founded)...

As it gets colder, below a certain temperature, energy spend goes up, linearly (AKA red line is straight) with temperature load.

To save energy you need :
  1. to move the green line down (reduce base load)
  2. to make the red line less steep (insulate or improve plant efficiency)
  3. a miracle


And that is pretty much the theory.  We only need to understand how the miracles occur (drum roll ....) !


Now, let us suppose people use the building ! (I know it's a radical concept and  a departure into the unknown that ruins a perfectly good theory ).


They are average people and there are lots of them, so we can describe them in terms of "typical behaviour".


So our very simple occupant people ( ok - no comments : )  are one of three things as follows  ...


  1. I'm too Hot -  I will open the window , turn the cooling on
  2. I'm too Cold - I will turn the up the thermostat or radiator valve
  3. I'm not Sure - I will complain about something else !
If we go on to assume our very simple occupant people are also very lazy, they do these things at different times - when really, really motivated.

1)  - Happens in early summer (when its horrendously hot and the heating is still where they put it !)

2)  - Happens in mid-fall / early winter - when it's getting really cold and the heating is low (or the cooling still on)

3) Ok - so in fact they complain all the time !

These things change the shape of our diagram as follows :

Chart of seasonal energy waste
The seasonal savings con.

If I install my energy saving equipment (it can be a bright orange blob of jelly - it really doesn't matter), and do a six month return survey - "to see how its doing"), I can "reconfigure" your heating system (aka turn it down for summer in late spring or summer), then tell you to continue keep a close eye on energy (achieving some small savings anyway) - My seasonally adjusted savings (for one year) will save a bunch of energy without ANY new technology.

If you are sceptical - look at this graph - The dots are days and the blue area is surrounded by month averages.

Chart of Energy Savings in Buildings automatically identified
Asymetric waste automatically identified by kWIQly


A good energy management dashboard can identify this automatically without site visits - I have NO idea where the above diagram comes from - it is based on an anonymous data feed combined with weather data that kWIQly provides.
Enhanced by Zemanta