Yesterday, we discussed the idea of treating energy managers like mushrooms (keep in the dark and feed BS) and "lies, damned-lies, and statistics" which led to this post. So if you have jumped straight into the page have a read of feeding lies to energy managers first.
The subject today is a simple explanation of why the following is a case of a statistic that is a "damned lie":
"We have an energy saving product that will save you > 15% in 'seasonally adjusted savings'. We will look at your last six months bills and get a pattern of use that is weather adjusted, we will implement product "X" in summer and monitor for another six months, and then you will use less energy, even after we have adjusted for the weather."
So, what is the implicit assumption here ? - it is absolutely obvious!
Answer : It assumes there is an the amount of heating energy you normally spend that depends on primarily on the weather !
This sounds reasonable - cold day - more heat - right ?
Wrong !
In reality the vast proportion of buildings do not work like this !
This is an alarming claim, so I will have to explain it (I have met a couple of energy managers over the years who immediately understood this - but it is complex, so excuse me if I spoon-feed a little).
To maintain comfort the above assumption is exactly right - this is the basis of degree-day analysis, by which most of the energy managers in the world are taught to analyse (and reasonably so - "but as a first approximation" ).
So here is the theory you were taught (and on which all degree-day analysis is founded)...
As it gets colder, below a certain temperature, energy spend goes up, linearly (AKA red line is straight) with temperature load.
To save energy you need :
- to move the green line down (reduce base load)
- to make the red line less steep (insulate or improve plant efficiency)
- a miracle
And that is pretty much the theory. We only need to understand how the miracles occur (drum roll ....) !
Now, let us suppose people use the building ! (I know it's a radical concept and a departure into the unknown that ruins a perfectly good theory ).
They are average people and there are lots of them, so we can describe them in terms of "typical behaviour".
So our very simple occupant people ( ok - no comments : ) are one of three things as follows ...
- I'm too Hot - I will open the window , turn the cooling on
- I'm too Cold - I will turn the up the thermostat or radiator valve
- I'm not Sure - I will complain about something else !
If we go on to assume our very simple occupant people are also very lazy, they do these things at different times - when really, really motivated.
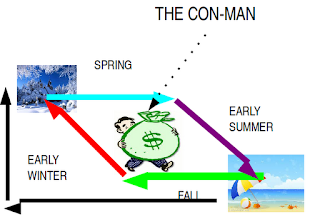
1) - Happens in early summer (when its horrendously hot and the heating is still where they put it !)
2) - Happens in mid-fall / early winter - when it's getting really cold and the heating is low (or the cooling still on)
3) Ok - so in fact they complain all the time !
These things change the shape of our diagram as follows :
 |
| The seasonal savings con. |
If I install my energy saving equipment (it can be a bright orange blob of jelly - it really doesn't matter), and do a six month return survey - "to see how its doing"), I can "reconfigure" your heating system (aka turn it down for summer in late spring or summer), then tell you to continue keep a close eye on energy (achieving some small savings anyway) - My seasonally adjusted savings (for one year) will save a bunch of energy without ANY new technology.
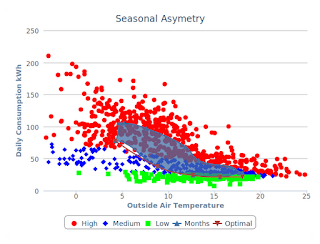
If you are sceptical - look at this graph - The dots are days and the blue area is surrounded by month averages.
 |
| Asymetric waste automatically identified by kWIQly |
A good energy management dashboard can identify this automatically without site visits - I have NO idea where the above diagram comes from - it is based on an anonymous data feed combined with weather data that kWIQly provides.


