 |
| Brienz Quay - print auction for Haiti (Photo credit: Mark Howells-Mead) |
If it is of any value to climate-change researchers or anyone else I am delighted. Please use it.
It comes from an idea that I had following a discussion with a neighbour Anni Blatter who like me enjoys swimming in our local lake, the Brienzer See, but has done so for more than 75 years !
As can be seen from the wonderful photos in this post, the colour of the lake changes, not only with cloud cover, and time of day, but with something else...
 The weather over the last few days.
What happens is that Glacial dust or rock flour is carried down into the lake by the contributary Aare from the Grimsel and Susten passes and from the Luetschinen rivers that flow from the Eiger and Jungfrau.
As you can see below they are very milky in appearance, because of this Glacial dust or Rock Flour
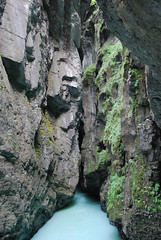 |
| Aare-Schlucht (Photo credit: yago1.com) |
This milky water traps heat extremely fast and so means that the top surface of the lake gets warmed up very fast (and can be lovely to swim in as early as March) when there is snow on the surrounding hills.
 |
| Eiger: (Photo credit: Wikipedia) |
But as soon as a wind blows, the colder deep water is churned up to the surface and it becomes bitterly cold, even at the end of summer.
If the air has been still - the water is therefore warm, and a lot of this milkiness will have settled out to the deeper water and so the water will change colour.
So, my neighbour (not an engineer but she ran the local red-cross :), has noticed that if the water is green it is cold. But I know if it is cold, it is because it has been de-stratified (stirred up), and therefore together we know that it is a particular colour, when it has been particularly windy.
 |
| Photo of rock flour (glacial flour) flowing into Peyto Lake, Banff National Park, Alberta, Canada (Photo credit: Wikipedia) |
This phenomenon occurs in waters all over the world, and is measurable from a single colour pixel.
It occurs to me, that if we have a satellite photo of a body of water, we have in effect a time-averaged photograph of historic wind patterns. These are naturally of far higher resolution than is available from existing weather models, or weather stations.
The albedo (or reflectivity) of water changes the rate of solar admittance and therefore the rate at which water and air are locally heated. So, subject to calibration (which will admittedly vary with season, precipitation, thawing and cloud cover in a complex way), I am suggesting that we could observe averaged recent weather conditions at extremely local resolution on the basis of widely available phenomena.
Now, I am no climatologist, simply an engineer who suffers occassional weird ideas like using the princess and the pea as an engineering analogy, with a slightly enquiring mind. However, I would dearly love to hear if anyone has any thoughts on the subject or if indeed someone has already looked into the practical details of using this method for monitoring weather.
PS - I have it on good authority that the answer is 42.
Please do pass this on to anyone you know who might know anything about how climate change people use weather data. Or just Tweet it if you feel like it :)
